
Deploy an OpenTelemetry Collector on Azure Container Apps with Application Insights
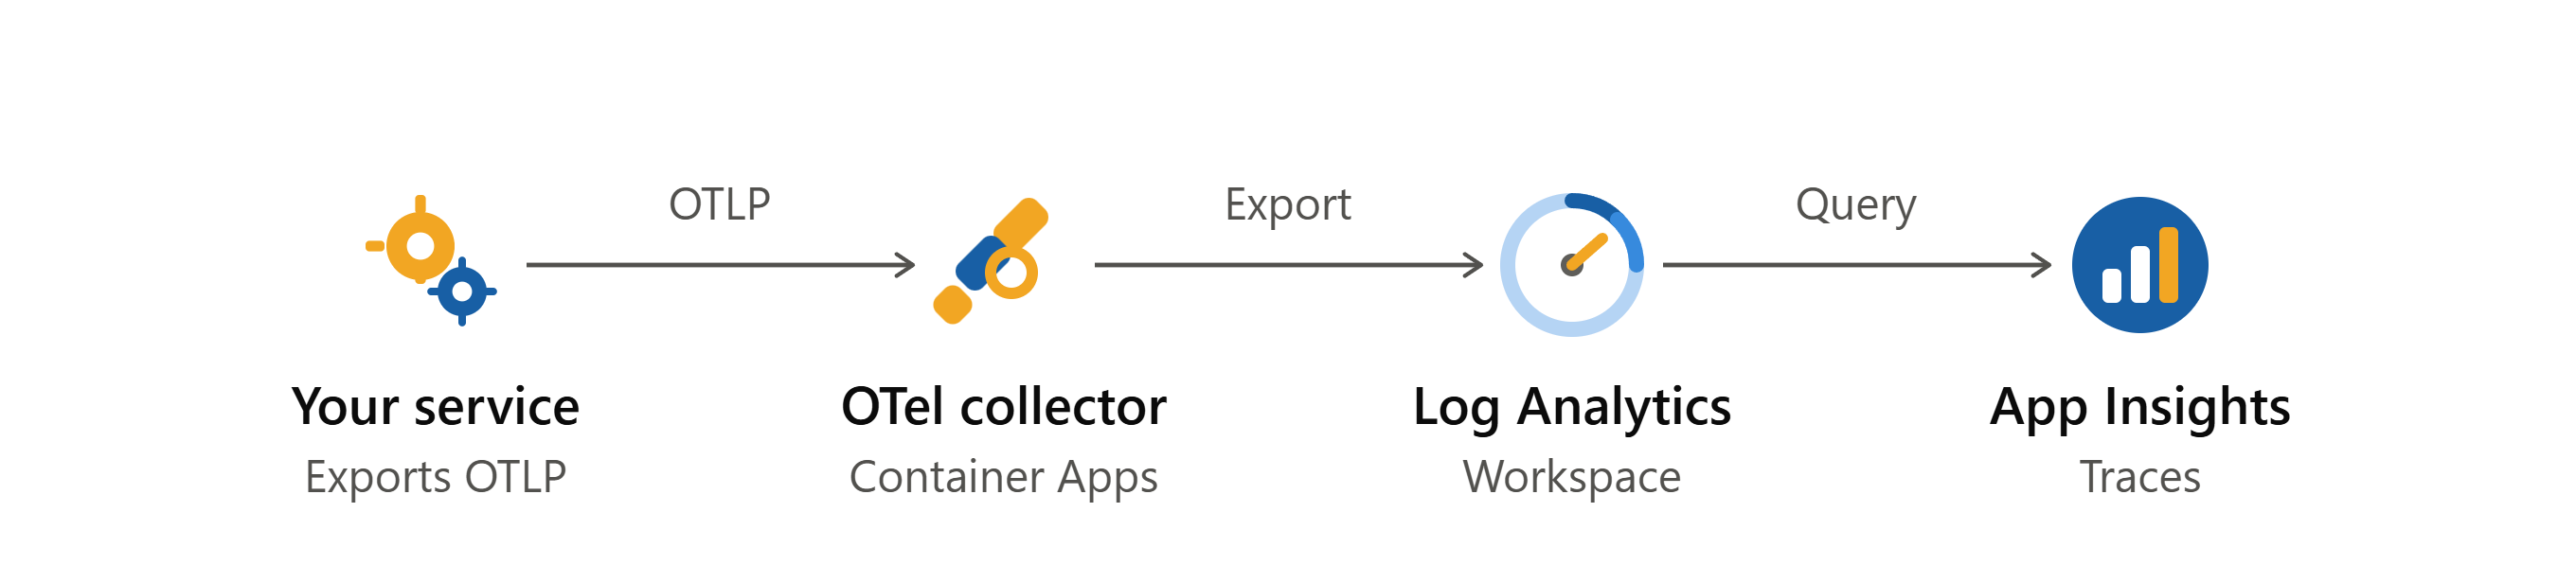
A minimal, scalable, working OTLP ingestion endpoint on Azure, using only three resources.
Your services emit OpenTelemetry. You want that telemetry in Application Insights, without every application carrying a connection string and without operating Jaeger, Tempo, or Prometheus alongside it. This walks through the full deployment: Log Analytics Workspace, workspace-based Application Insights, an OpenTelemetry Collector as a Container App — with the Azure CLI commands for each step and a test trace at the end.
What we deploy
| Component | Purpose |
|---|---|
| Log Analytics Workspace | Storage backend for all telemetry |
| Application Insights (workspace-based) | Ingestion endpoint + trace/dependency UI |
| Container App | OTel Collector, receives OTLP and exports to App Insights |
| Container App Secret | Holds the collector config |
Why this is enough
- The collector is stateless. It receives, batches, forwards. No volumes, no database, no leader election. A single scalable container image with one config file.
- Application Insights already is the backend. Ingestion, storage, retention, and the trace UI come with the workspace.
- Workspace-based App Insights means one storage layer. Traces, metrics, and logs land in the same Log Analytics Workspace and are queryable with a single KQL query.
- The config is a secret, not an image layer. Changing the pipeline means updating a secret and restarting a revision — no rebuild, no registry push.
- Container Apps scales on HTTP load without a cluster to maintain.
1. Log Analytics Workspace and Application Insights
For a reproducible setup we use the Azure CLI in bash throughout: Set the variables once:
RG="rg-observability"
LOCATION="germanywestcentral"
WORKSPACE="law-observability"
APPINSIGHTS="appi-observability"
Resource group and workspace:
az group create \
  --name "$RG" \
  --location "$LOCATION"

az monitor log-analytics workspace create \
  --resource-group "$RG" \
  --workspace-name "$WORKSPACE" \
  --location "$LOCATION" \
  --retention-time 30
Application Insights, bound to the workspace:
WORKSPACE_ID=$(az monitor log-analytics workspace show \
  --resource-group "$RG" \
  --workspace-name "$WORKSPACE" \
  --query id -o tsv)

az monitor app-insights component create \
  --resource-group "$RG" \
  --app "$APPINSIGHTS" \
  --location "$LOCATION" \
  --workspace "$WORKSPACE_ID" \
  --application-type web
--workspace is what makes this workspace-based. Without it you get a classic instance with its own separate storage.
Read the connection string — the collector needs it:
CONNECTION_STRING=$(az monitor app-insights component show \
  --resource-group "$RG" \
  --app "$APPINSIGHTS" \
  --query connectionString -o tsv)

echo "$CONNECTION_STRING"
Output looks like this:
InstrumentationKey=00000000-0000-0000-0000-000000000000;IngestionEndpoint=https://germanywestcentral-1.in.applicationinsights.azure.com/;LiveEndpoint=...
The ingestion endpoint is region-bound. Never copy a connection string between regions. Save this.
2. Container Apps Environment and Collector App
The app is deployed first with the image's default config. The real config follows in step 4 as a secret.
ENVIRONMENT="cae-observability"
APP="ca-otel-collector"
IMAGE="otel/opentelemetry-collector-contrib:latest"
Install the extension and register the provider (once per subscription):
az extension add --name containerapp --upgrade
az provider register --namespace Microsoft.App
Environment, wired to the same workspace so container logs land there too:
WORKSPACE_CUSTOMER_ID=$(az monitor log-analytics workspace show \
  --resource-group "$RG" \
  --workspace-name "$WORKSPACE" \
  --query customerId -o tsv)

WORKSPACE_KEY=$(az monitor log-analytics workspace get-shared-keys \
  --resource-group "$RG" \
  --workspace-name "$WORKSPACE" \
  --query primarySharedKey -o tsv)

az containerapp env create \
  --resource-group "$RG" \
  --name "$ENVIRONMENT" \
  --location "$LOCATION" \
  --logs-workspace-id "$WORKSPACE_CUSTOMER_ID" \
  --logs-workspace-key "$WORKSPACE_KEY"
The collector app:
az containerapp create \
  --resource-group "$RG" \
  --name "$APP" \
  --environment "$ENVIRONMENT" \
  --image "$IMAGE" \
  --target-port 4318 \
  --ingress internal \
  --transport http \
  --min-replicas 1 \
  --max-replicas 3 \
  --cpu 0.5 \
  --memory 1.0Gi
Key choices:
| Flag | Why |
|---|---|
--target-port 4318 | OTLP/HTTP. Container Apps exposes exactly one port. |
--ingress internal | Reachable only inside the environment/VNet. Use external only with IP restrictions in place. |
--min-replicas 1 | Prevents scale-to-zero. A cold collector drops the spans that wake it. |
On gRPC (4317): Container Apps ingress exposes a single port, so you get either OTLP/HTTP or OTLP/gRPC per app — not both. HTTP is the safer default; it works through APIM and any proxy. If you need gRPC, set --transport http2 and --target-port 4317, or deploy a second app.
Check the FQDN — that's your OTLP endpoint:
az containerapp show \
  --resource-group "$RG" \
  --name "$APP" \
  --query properties.configuration.ingress.fqdn -o tsv
Senders point at https://<fqdn>/v1/traces, /v1/metrics, /v1/logs.
3. The collector config
collector-config.yaml
receivers:
  otlp:
    protocols:
      http:
        endpoint: 0.0.0.0:4318

processors:
  batch:
    timeout: 10s
    send_batch_size: 1024
  memory_limiter:
    check_interval: 1s
    limit_percentage: 80
    spike_limit_percentage: 20

exporters:
  azuremonitor:
    connection_string: ${env:APPLICATIONINSIGHTS_CONNECTION_STRING}

service:
  pipelines:
    traces:
      receivers: [otlp]
      processors: [memory_limiter, batch]
      exporters: [azuremonitor]
    metrics:
      receivers: [otlp]
      processors: [memory_limiter, batch]
      exporters: [azuremonitor]
    logs:
      receivers: [otlp]
      processors: [memory_limiter, batch]
      exporters: [azuremonitor]
Save this as collector-config.yaml
Section by section
| Section | What it does |
|---|---|
receivers | Where telemetry comes in. 0.0.0.0 is required — binding to localhost makes the container unreachable. |
processors | Transform between receive and export. Order matters. |
exporters | Where telemetry goes out. |
service | Wires the three together. A component not referenced here is not loaded. |
Processor order
Processors run top to bottom as listed in the pipeline, not as declared above.
memory_limiterfirst — it can only protect the collector if it sees data before anything buffers it.batchlast — always the final processor.
Details worth knowing
memory_limiterapplies backpressure when the container approaches its memory limit. Without it, a traffic spike OOM-kills the container and you lose everything in flight. Mandatory in production.${env:...}resolves at startup. The connection string stays out of the config and out of any image layer.- Four top-level keys only:
receivers,processors,exporters,service. Each appears exactly once. A duplicate key gives youmapping key already defined. - No
debugexporter here. It writes every item to stdout. See Activate debug mode at the end.
4. Store the config and connection string as a secret
The config never contains the connection string. It references an environment variable, which we fill from a second secret in the next step.
${env:APPLICATIONINSIGHTS_CONNECTION_STRING} is resolved by the collector at startup. The config stays identical across dev, test, and production — only the env variable changes.
Choose one: Portal
Multiline YAML through the shell is where this step usually breaks: quoting, escaping, newlines collapsing into one line. Use the portal.
- Container App → Settings → Secrets
- Add, name
collector-config, paste the YAML from step 3 - Add, name
appinsights-connection-string, paste the connection string from step 1 (In Terminal echo $CONNECTION_STRING) - Save
Pasting into a textarea keeps the YAML intact. No escaping.
Choose one: CLI
az containerapp secret set \
  --resource-group "$RG" \
  --name "$APP" \
  --secrets \
    "collector-config=$(cat collector-config.yaml)" \
    "appinsights-connection-string=$CONNECTION_STRING"
The double quotes around $(cat ...) preserve the newlines. Without them the YAML becomes one line and the collector won't start.
az containerapp secret list \
  --resource-group "$RG" \
  --name "$APP" \
  -o table
Notes
- Names must be lowercase alphanumeric with dashes.
collector-configworks,collectorConfigdoes not. - Values are write-only.
secret listreturns names only, the portal hides values after saving. Keepcollector-config.yamlin Git — the secret is a deployment artifact, not the source of truth. - Secrets are encrypted at rest and scoped to the app.
No Key Vault here. It adds a resource, a managed identity, and an RBAC assignment — three moving parts for two values that are already encrypted and app-scoped. Worth it once multiple apps share secrets or you need enforced rotation. Not for this.
5. Mount the config and set the env variable
Two different mechanisms, one for each secret:
| Secret | Mechanism | Why |
|---|---|---|
collector-config | Volume mount → file | The collector reads config from a file path |
appinsights-connection-string | Environment variable | Referenced as ${env:...} inside the config |
Full app definition
Secret volumes aren't exposed as CLI flags, so this step goes through an inline YAML document.
az containerapp update \
  --resource-group "$RG" \
  --name "$APP" \
  --yaml <(cat <<EOF
properties:
  template:
    containers:
      - name: otel-collector
        image: otel/opentelemetry-collector-contrib:latest
        args: ["--config=/etc/collector/config.yaml"]
        env:
          - name: APPLICATIONINSIGHTS_CONNECTION_STRING
            secretRef: appinsights-connection-string
        volumeMounts:
          - volumeName: config-volume
            mountPath: /etc/collector
    volumes:
      - name: config-volume
        storageType: Secret
        secrets:
          - secretRef: collector-config
            path: config.yaml
EOF
)
How it fits together
Secret "collector-config"              → file  /etc/collector/config.yaml
Secret "appinsights-connection-string" → env   APPLICATIONINSIGHTS_CONNECTION_STRING
                                                        ↓
                              config.yaml: ${env:APPLICATIONINSIGHTS_CONNECTION_STRING}
The collector reads the file, resolves the variable at startup, and never has the connection string written down anywhere.
Details that matter
path: config.yamlsets the filename inside the mount. Without it the file is named after the secret (collector-config) and--configwon't find it.argsoverrides the image default. The contrib image looks for/etc/otelcol-contrib/config.yaml. Mounting to a separate path and passing--configexplicitly avoids shadowing the image's own directory.secretRefinenvinjects the value without exposing it in the revision spec.- Every update creates a new revision. Secret changes alone don't restart running containers — you need a revision restart:
az containerapp revision restart \
  --resource-group "$RG" \
  --name "$APP" \
  --revision $(az containerapp revision list \
    --resource-group "$RG" --name "$APP" \
    --query "[0].name" -o tsv)
Verify
az containerapp logs show \
  --resource-group "$RG" \
  --name "$APP" \
  --follow
A healthy start ends with Everything is ready. Begin running and processing data.
Common failures:
| Log line | Cause |
|---|---|
no such file or directory | path: missing in the volume definition |
mapping key already defined | Duplicate top-level key in the YAML |
references exporter "x" which is not configured | Pipeline references an undeclared component |
expanding ${env:...}, variable not set | Env variable name doesn't match the config |
6. Send a test trace from CLI
Reachability first: with --ingress internal the endpoint only resolves inside the Container Apps environment. For a quick test from the portal cli, switch it to external temporarily:
az containerapp ingress update \
  --resource-group "$RG" --name "$APP" --type external

FQDN=$(az containerapp show \
  --resource-group "$RG" --name "$APP" \
  --query properties.configuration.ingress.fqdn -o tsv)

echo "$FQDN"
Switch it back to internal when you're done.
The script
TRACE_ID=$(openssl rand -hex 16)
SPAN_ID=$(openssl rand -hex 8)
NOW=$(($(date +%s) * 1000000000))
END=$((NOW + 250000000))

curl -i -X POST "https://$FQDN/v1/traces" \
  -H "Content-Type: application/json" \
  -d '{
  "resourceSpans": [{
    "resource": {
      "attributes": [{
        "key": "service.name",
        "value": { "stringValue": "cli-test" }
      }]
    },
    "scopeSpans": [{
      "spans": [{
        "traceId": "'"$TRACE_ID"'",
        "spanId": "'"$SPAN_ID"'",
        "name": "manual-test-span",
        "kind": 2,
        "startTimeUnixNano": "'"$NOW"'",
        "endTimeUnixNano": "'"$END"'"
      }]
    }]
  }]
}'
HTTP/1.1 200 OK with body {} means accepted.
Payload notes
| Field | Requirement |
|---|---|
traceId | 32 hex characters. Wrong length is rejected. |
spanId | 16 hex characters. |
*TimeUnixNano | Nanoseconds, as a string. JSON numbers overflow at this magnitude. |
kind | 2 = SERVER, appears as a request in Application Insights. |
service.name | Becomes cloud_RoleName. Without it the span is hard to find. |
Verify in Application Insights Logs
Ingestion takes 1–3 minutes:
requests
| where cloud_RoleName == "cli-test"
| order by timestamp desc
Or Application Insights → Transaction search.
If nothing arrives
| Check | How |
|---|---|
| Did the collector accept it? | az containerapp logs show --follow in a second Cloud Shell tab during the call |
| Is the connection string set? | Look for azuremonitor errors in the collector logs |
| Right region? | Ingestion endpoint must match the App Insights region |
| Waited long enough? | Give it 5 minutes before concluding it failed |
Close the endpoint again
Once the span shows up, put the collector back behind internal ingress:
az containerapp ingress update \
  --resource-group "$RG" --name "$APP" --type internal
Verify it's no longer public:
az containerapp show \
  --resource-group "$RG" --name "$APP" \
  --query properties.configuration.ingress.external -o tsv
false is what you want. An OTLP receiver on a public endpoint accepts telemetry from anyone who finds it — that's both a billing problem and a data integrity problem. Don't leave it open or at least restrict its IP range.
7. Troubleshooting: debug exporter
When telemetry doesn't arrive and you need to know whether it even reaches the collector, add the debug exporter and put it next to azuremonitor in the pipeline you're investigating:
Updating the secret does not restart running containers. Restart the revision afterwards — see step 5.
exporters:
  debug:
    verbosity: detailed      # basic | normal | detailed
    sampling_initial: 5      # first 5 records per second are printed
    sampling_thereafter: 200 # after that, every 200th
service:
  pipelines:
    traces:
      receivers: [otlp]
      processors: [memory_limiter, batch]
      exporters: [azuremonitor, debug]
